Life Terra Foundation intends to plant 500 million trees in the next years. Trees, forest stands, and forest ecosystems provide several essential benefits to mankind and nature. Carbon sequestration is one of these benefits. One big challenge for us is to transparently quantify the carbon sequestered in tree biomass by our plantations to monitor the progress not only in terms of trees planted, but also in terms of CO₂ offset that these trees represent.
To make the estimation feasible, given the diversity and geographical scale of Life Terra plantings, the procedure was designed with respect to the actual input information available, providing information on uncertainty considerations with respect to the expected mortality and options to increase accuracy using locally available biomass equations and sampling programs such as sample-based national forest inventories. The estimation procedure is designed to be applicable at both tree and stand level.
See below a practical example of how we estimate the carbon sequestrated in 40 years in one of our plantings. Additionally, a detailed description of the methodology used by Life Terra to estimate the carbon captured by our trees can be seen here (Updated on 30/05/2025).
Life Terra always tries to be as transparent as possible, so if you have any feedback or data that can help us provide more accurate estimates please contact us and we will be happy to listen to you and improve our methodology.
Biomass estimation example
Step-by-step biomass estimation at 40 years of age of the Life Terra plantation in Bellprat, Cataluña (Spain). Planting date: Winter 2022.
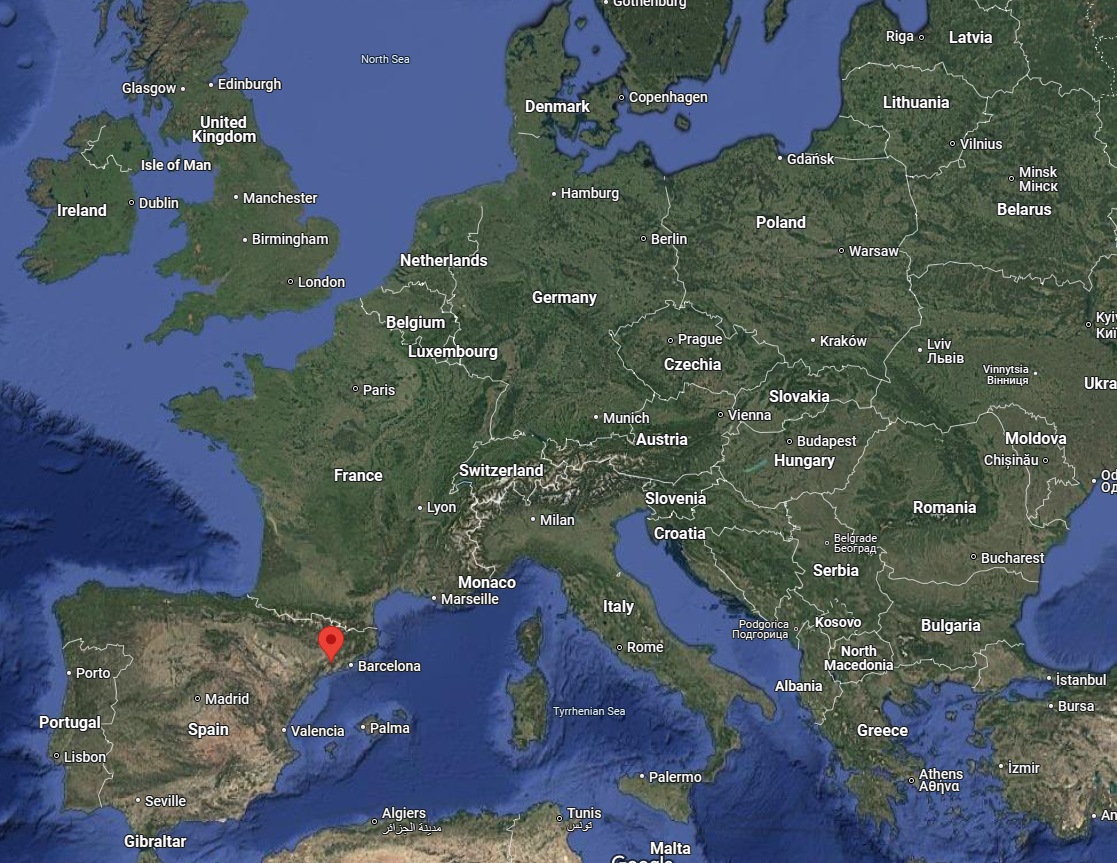
Location: Bellprat, Spain
Objective of the plantation: Ecological restoration
Area of the plantation: 1.91 ha
Number of trees planted: 2,172 trees ≈ 1.138 trees/ha
Olea europaea 300 trees ≈ 157 trees/ha broadleaved
Pistacia lentiscus 145 trees ≈ 76 trees/ha shrub
Pinus pinea 290 trees ≈ 152 trees/ha conifer
Pistacia terebinthus 145 trees ≈ 76 trees/ha shrub
Quercus ilex 292 ≈ 152 trees/ha broadleaved
Crataegus monogyna 145 ≈ 76 trees/ha shrub
Juniperus thurifera 277 ≈ 145 trees/ha shrub
Pinus halepensis 145 ≈ 76 trees/ha conifer
Prunus avium 290 ≈ 152 trees/ha broadleaved
Arbutus unedo 145 ≈ 76 trees/ha shrub
Step 1: Country of planting
The country where the planting took place is Spain. As there is data available for Spain, the respective biomass values at tree level will be used.
In case there was no country specific data available, the respective biogeographic region (in this case Mediterranean) biomass values at tree level would be used.
Step 2: Total biomass at tree level
Using the biomass values by country, tree species and site indexes, the following results are obtained:
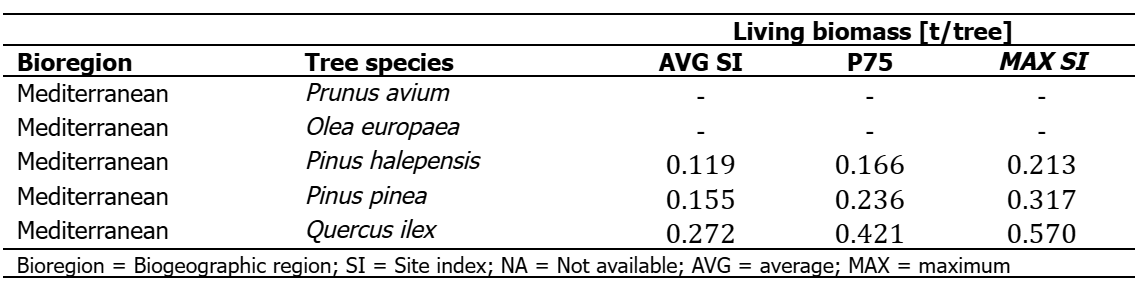
Dry weight biomass for individual trees at 40 years age. Example of calculation in a Life Terra plantation located in Spain.
As can be seen in the table above, there is no available data for three tree species (P. avium and O. europaea).
Step 3: Groups of species
By adding the species groups (check more info in the document linked above), the following table can be constructed :
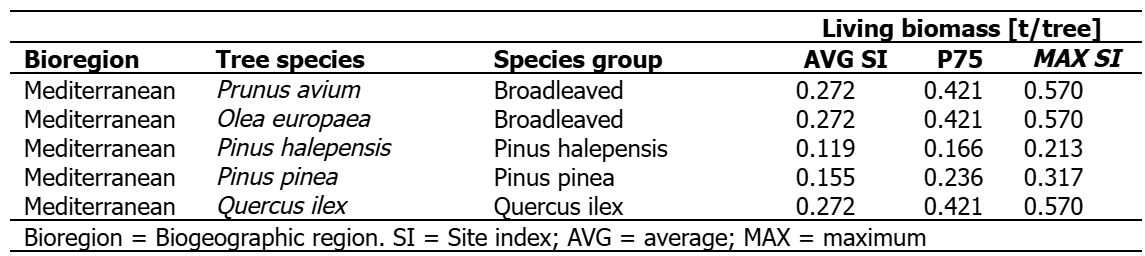
Dry weight biomass for individual trees at 40 years age using groups of species. Example of calculation in a Life Terra plantation located in Spain.
Step 4: Upscaling from tree level to stand level
The mathematical procedure: multiplying the total dry weight biomass [t/tree] by the total number of trees planted for each biogeographic region, tree species and site index conditions.
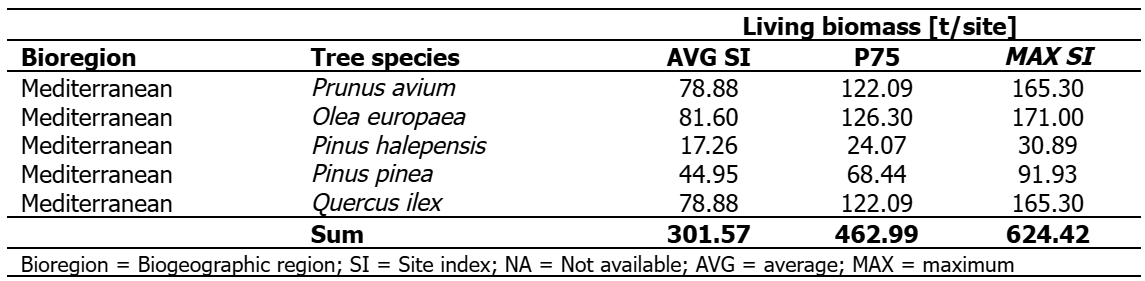
Total dry weight biomass at 40 years age. Example of calculation in a Life Terra plantation located in Spain.
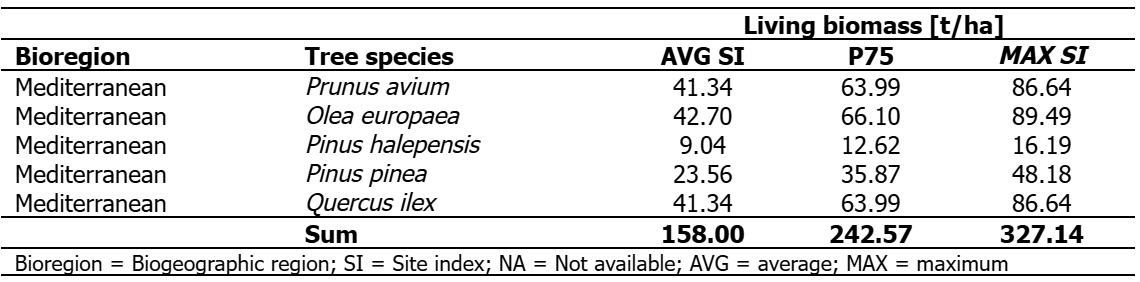
Total dry weight biomass per hectare at 40 years age. Example of calculation in a Life Terra plantation located in Spain.
Step 5: Mortality and survival rate
The survival rate for ecological restoration plantings is assumed to be 50% for all tree species, regardless of stand density at planting. This assumption is based on the limited availability of published data for non-timber plantations.
Results:
Life Terra planted 2172 trees in Bellprat, Spain, covering an area of 1.91 ha. Applying a 50% survival rate to the values in Table above, the estimated dry matter at age 40 would range from 150.78 to 312.21 tons (mid-value 231.50 t). This, expressed in tons of CO2 equivalent, gives 276.43 and 572.39 t CO2 eq. with a midpoint of 424.42 t CO2 eq